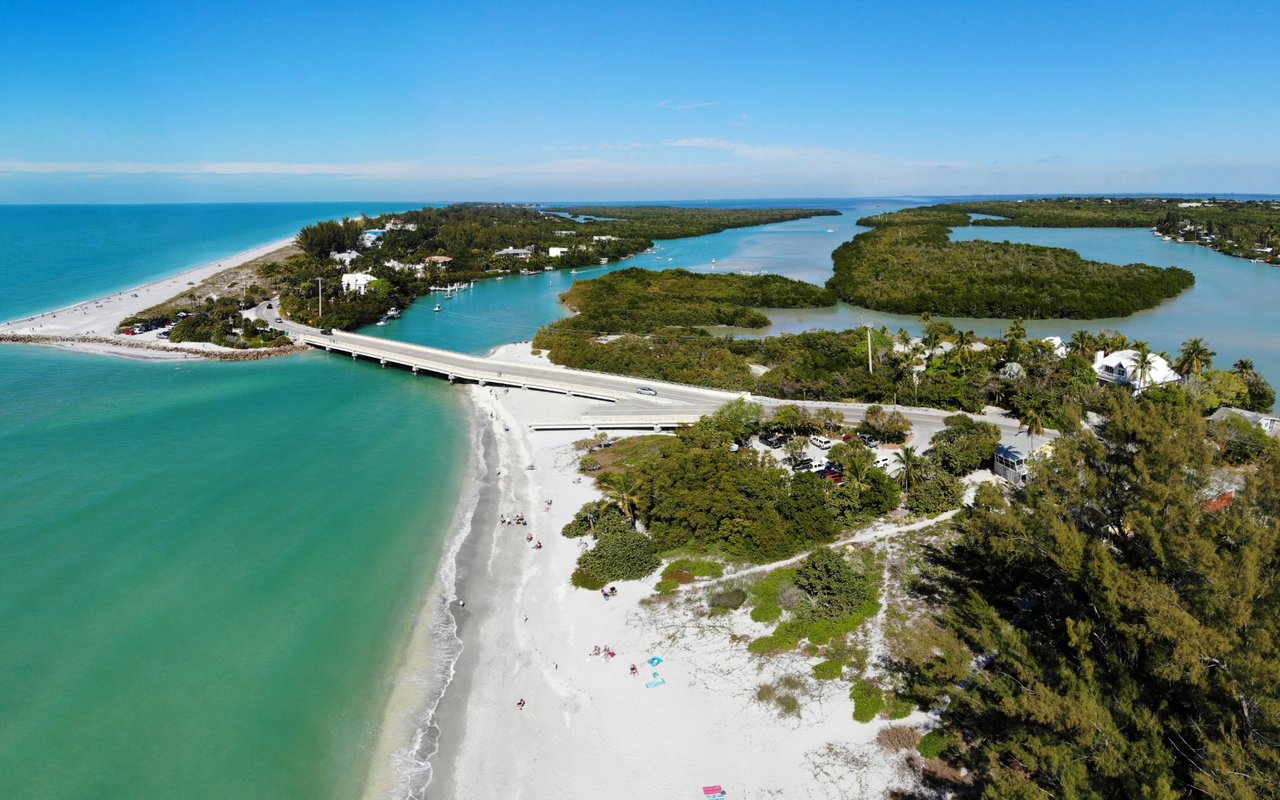
51 people live in Captiva / Sanibel Island, where the median age is 38 and the average individual income is $35,145. Data provided by the U.S. Census Bureau.
Total Population
Median Age
Population Density Population Density This is the number of people per square mile in a neighborhood.
Average individual Income
There's plenty to do around Captiva / Sanibel Island, including shopping, dining, nightlife, parks, and more. Data provided by Walk Score and Yelp.
Explore popular things to do in the area, including Yolo Board Adventures, Capt. Shawn Kelly's Fishing Charters, and Native Guides Fishing.
| Name | Category | Distance | Reviews |
Ratings by
Yelp
|
|---|---|---|---|---|
| Active | 3.07 miles | 18 reviews | 5/5 stars | |
| Active | 0.27 miles | 5 reviews | 5/5 stars | |
| Active | 0.99 miles | 5 reviews | 5/5 stars | |
|
|
||||
|
|
||||
|
|
||||
|
|
||||
|
|
||||
|
|
Captiva / Sanibel Island has 23 households, with an average household size of 1. Data provided by the U.S. Census Bureau. Here’s what the people living in Captiva / Sanibel Island do for work — and how long it takes them to get there. Data provided by the U.S. Census Bureau.
Total Population
Population Density Population Density This is the number of people per square mile in a neighborhood.
Median Age
Men vs Women
Population by Age Group
0-9 Years
10-17 Years
18-24 Years
25-64 Years
65-74 Years
75+ Years
Education Level
Total Households
Average Household Size
Average individual Income
Marital Status
Blue vs White Collar Workers
Blue Collar:
White Collar:
Janice believes the best transactions feel seamless — because the groundwork was laid long before the offer was made. She'd love to learn more about what you're looking for. Let’s start the conversation!